Blackhawks 3, Sabres 2 (OT): Buffalo had more of the chances for 60 minutes and still lost
Buffalo had more of the chances over 60 minutes and led 2-1 into the third. Chicago tied it and won in overtime, the pattern our pregame flagged for tired road teams.
Finding: Over 60 minutes, the Sabres' chances were worth 2.1 goals to Chicago's 1.9, and they led 2-1 into the third. Chicago tied it with 11:38 left and won 3:12 into overtime. That fits the pattern from our pregame story: road teams on the second night of a back-to-back lose more often than their chances say. One game can't prove it. Our 57% call for a Buffalo win is a miss.
One game, Nov. 12, in Chicago, the second night of a back-to-back for Buffalo. Our pregame story.
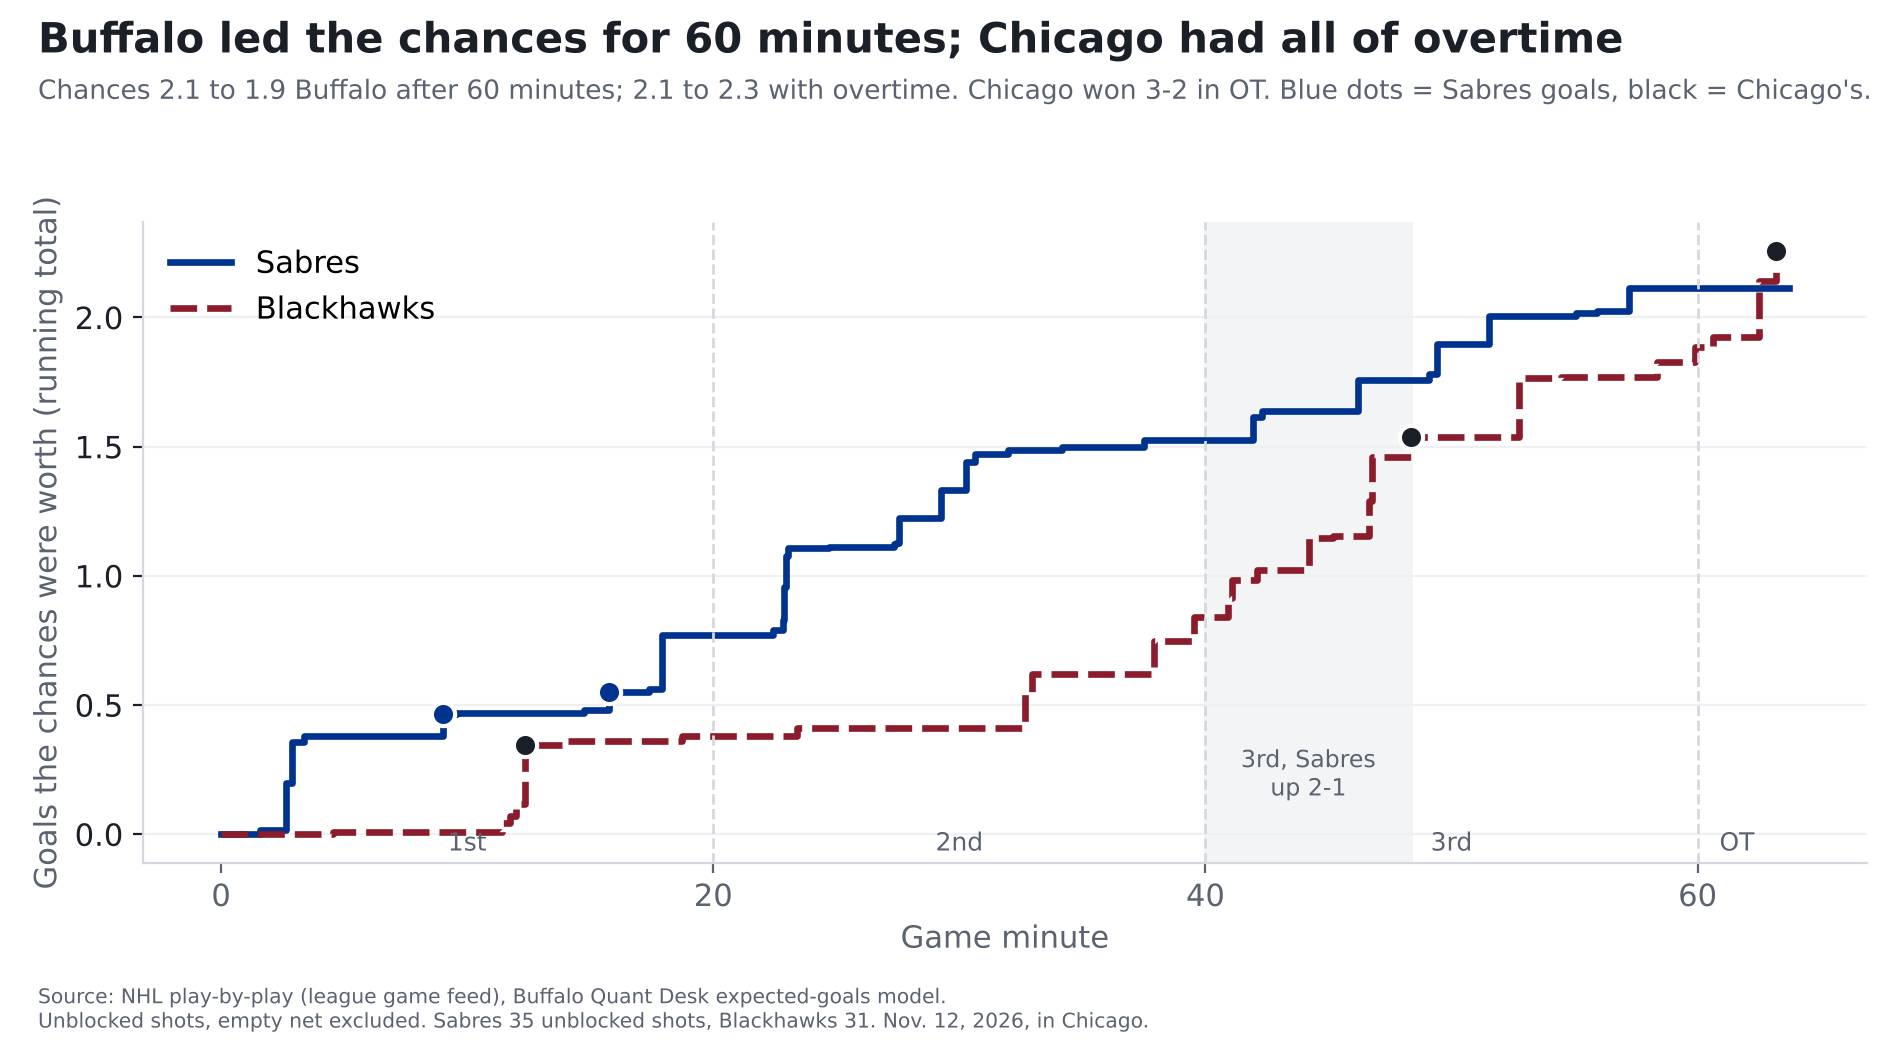
How it went
| Period | Sabres chances, in goals | Blackhawks chances, in goals |
|---|---|---|
| 1st | 0.8 (10 shots) | 0.4 (8 shots) |
| 2nd | 0.8 (16 shots) | 0.5 (7 shots) |
| 3rd | 0.6 (9 shots) | 1.0 (13 shots) |
| Overtime | 0.0 (0 shots) | 0.4 (3 shots) |
Shots counted here are the ones that weren't blocked, not counting empty nets.
| Period | Time | Team | Scorer | Shot | Chance it went in | Score |
|---|---|---|---|---|---|---|
| 1 | 9:00 | Sabres | Owen Power | slap from 36 ft | 9% | 1-0 |
| 1 | 12:22 | Blackhawks | Frank Nazar | wrist from 5 ft, power play | 23% | 1-1 |
| 1 | 15:46 | Sabres | Tage Thompson | wrist from 29 ft, power play | 7% | 2-1 |
| 3 | 8:22 | Blackhawks | Frank Nazar | tip-in from 16 ft | 8% | 2-2 |
| OT | 3:12 | Blackhawks | Ryan Donato | wrist from 32 ft, 3-on-3 | 11% | 2-3 |
Our pregame story said to watch the first period, because tired road teams usually start a little behind. Buffalo didn't: it had 67% of the chances in the first and 62% in the second. In regulation the chances came out 2.1 to 1.9 Buffalo. Replay those 60 minutes over and over, with each shot going in or missing at its own chance, and Buffalo wins 44% of the time and Chicago 35%; the other 21%, it's tied after 60. That's what happened: 2-2 after 60, and overtime belonged to Chicago: 3 shots to none.
How we measure "chances"
Every shot has a chance of going in, based on where it was taken and what kind of shot it was. Frank Nazar's first goal, from 5 feet, had a 23% chance; Tage Thompson's power-play goal from 29 feet, about 7%. Add those chances up over a game and you get what a team's chances were worth in goals: all 31 of Chicago's shots, overtime included, were worth 2.3, and Chicago scored 3. In regulation alone it was 2.1 for Buffalo, 1.9 for Chicago; Chicago's last 0.4 came in overtime. The shot locations come from the NHL's own play-by-play. (The full explanation is in our story on last year's 50-win season.)
The third period
Buffalo led 2-1 from 15:46 of the first until Nazar's tip-in 8:22 into the third. In those first 8:22 of the third, the Sabres had 3 shots that weren't blocked, worth 0.2 goals, and Chicago had 8, worth 0.7: 25% of the chances for Buffalo. A team up a goal at that point of the third usually gets about 47%, since the trailing team pushes. About 38% of Chicago's chances in that stretch came on a power play or at 4-on-4.
It's 11 shots in about eight minutes, and stretches like that swing a lot: across the NHL since 2023-24, about 32% of teams up a goal in the same part of the third got 25% of the chances or less (2,319 teams in that spot). After the tie, the chances were even until overtime.
The back-to-back
Our pregame story found that road teams playing the second night in a row, against a rested home team, win less often, without falling far behind in the chances. Thursday fit that: Buffalo had more of the chances in regulation and still lost. One game doesn't confirm it, and we still don't know why it happens.
It's not that tired teams fade late. Split their chances by period (644 games since 2023-24, not counting Thursday's), and they're a little behind all game, not more in the third:
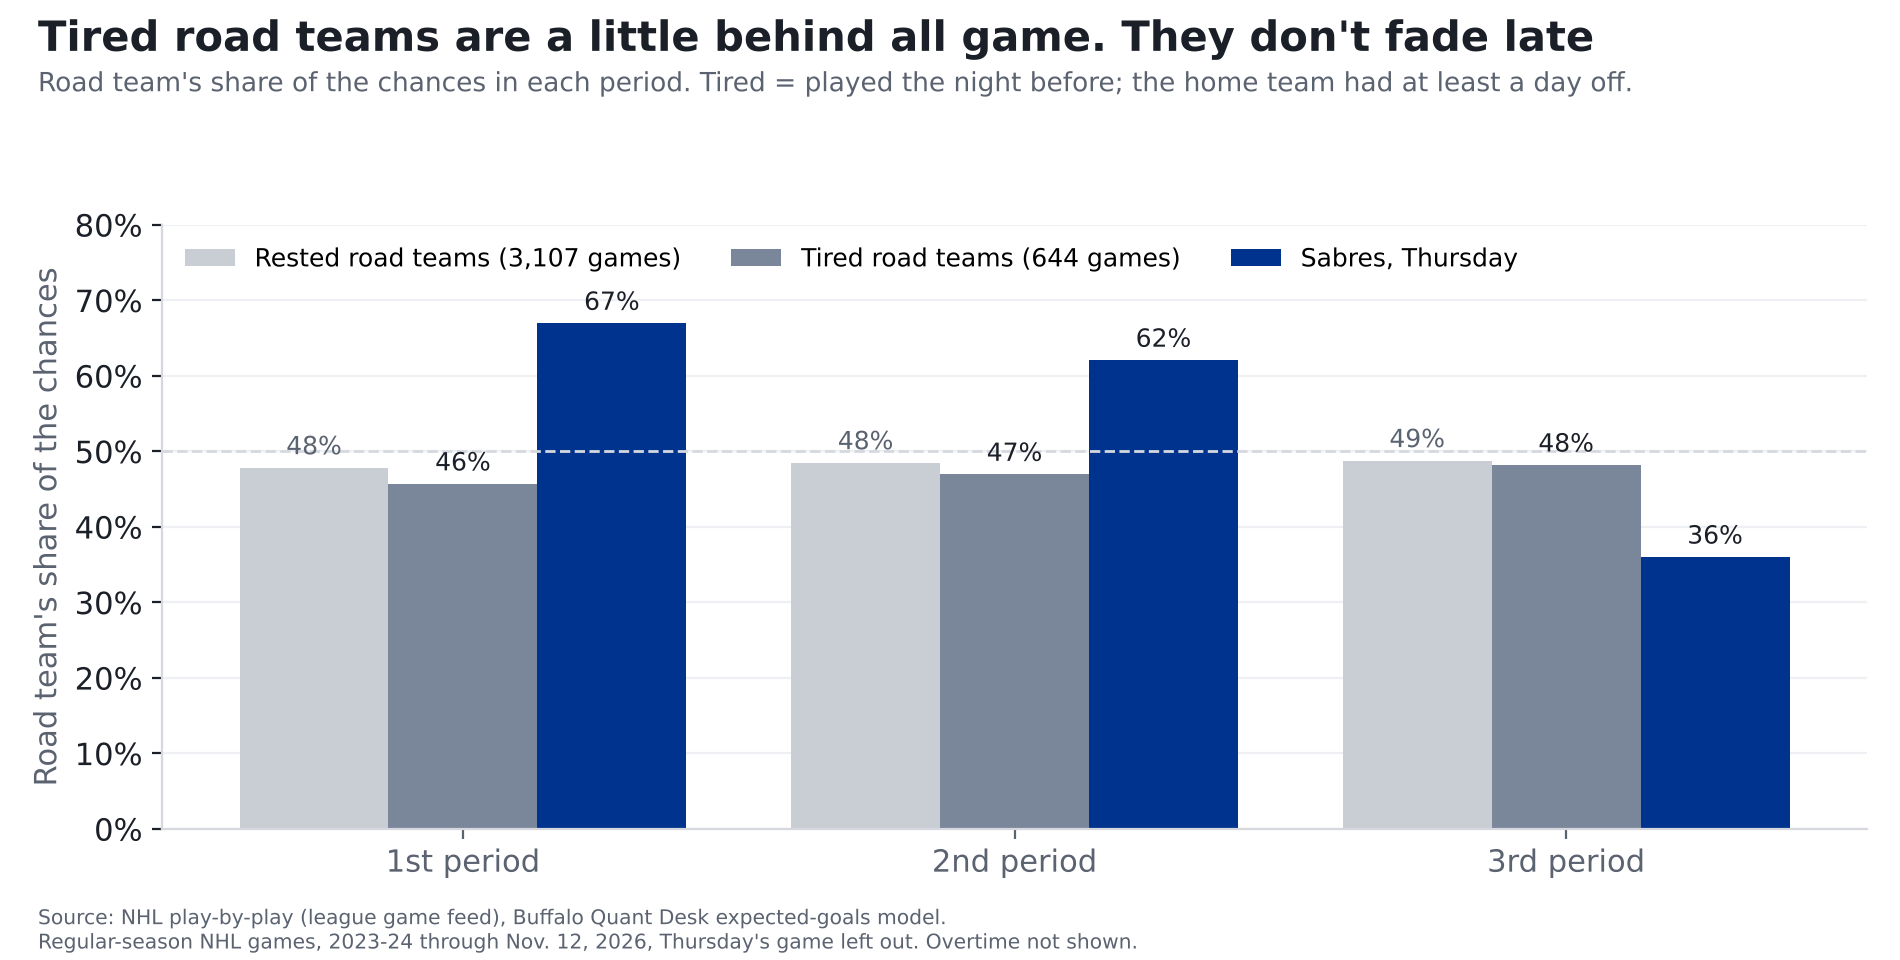
One thing did follow the usual pattern: in the pregame we found that a tired road team's usual starter was in net only 37% of the time, and Thursday Buffalo started its third goalie. But in those past games, the goalies who played were only about 0.06 of a goal a game worse than average, so that isn't the whole answer either.
In goal
Alex Lyon started for Buffalo after both of the Sabres' regular goalies played in Wednesday's 8-3 loss to Tampa Bay. It was his first NHL game this season. He faced Chicago shots worth 2.3 goals and allowed 3, 0.7 more than an average goalie would have. At the other end, Spencer Knight stopped 21 of 23, 0.1 goals better than average. Neither night was far from average.
Receipts: our pregame call
Before the game we logged a 57% chance the Sabres win on the Ledger. They lost in overtime, so it's a miss. Scored the usual way (the gap between our chance and what happened, squared; lower is better), it comes to 0.32, worse than a 50/50 guess's 0.25. Our record on graded calls is now 7 of 10.
Our pregame story said to read the 57% as too high, because the model doesn't know about back-to-backs. Chicago won, the way that warning pointed, but one game can't confirm it, and the 57% is what we logged and what gets graded. The model expected about 3.5 goals for Buffalo and 3.0 for Chicago; after 60 minutes it was 2-2, on chances worth 2.1 and 1.9. Both teams created less than the model thought; the edge went the way it expected.
What it means for Buffalo
- The Sabres had the better of the team that creates the fewest chances, as expected, though both teams created less than our model thought. In the standings it's one point from a game they had the better of.
- The third-period stretch is one to watch, not a trend yet. If Buffalo keeps getting this far out-chanced with a lead, it'll show up in more than one game.
For the stat-heads
- Expected goals (xG): our gradient-boosted model on unblocked, non-empty-net shots, rescaled per season so league xG equals league goals (2026-27 factor 0.992). BUF 2.11 xG on 35 unblocked shots (23 on goal); CHI 2.26 on 31 (25 on goal). Regulation: BUF 2.11, CHI 1.89. Through two periods: BUF 1.53, CHI 0.84.
- Third period with BUF +1 (40:00 to 48:22): BUF 0.23 xG (3, all 5v5), CHI 0.69 (8; 0.26 at 5v4 or 4v4). BUF 5v5 share 0.35. League comparison: shots in the first 8:22 of the third with a one-goal margin, pulled-goalie strengths excluded, 2023-24 to date: leader's xG share 0.467; per game, 0.315 of leaders got 0.25 or less (2,319 game-leaders).
- Back-to-back split: road xG share by period, tired (road rest 1, home rest 2+) P1 0.457, P2 0.470, P3 0.482; rested (both 2+) P1 0.478, P2 0.485, P3 0.488. Tired minus rested, with 95% game-resampling ranges: P1 -2.1 pts (-3.4 to -0.7); P2 -1.5 pts (-2.9 to -0.2); P3 -0.6 pts (-1.9 to +0.9). Games: 644 / 3,107. Regulation only; by-period shares are not score-adjusted (tired road teams trail more often late, which lifts their third-period share).
- Replays: exact Poisson-binomial over regulation shots (each an independent Bernoulli with p = xG). BUF win 0.438, tie 0.215, loss 0.347.
- GSAx = xG on unblocked shots faced minus goals allowed. Lyon -0.74 (25 SOG), Knight +0.11 (23 SOG).
- Ledger P0010: p = 0.57, outcome 0 (CHI won in OT; any result counts), Brier 0.3249. Model nhl-game-v0.1; its 3.45 / 2.97 are expected goals for 60 minutes.